Mains voltage and frequency versus time: some comments

The effect of mains frequency
Remember the event of 9th August 2019, when large swathes of the UK power grid went down? Ofgem's report on the incident makes it clear that the principal issue was the drop in grid frequency as two major power generators suddenly went offline due to an unexpected response to a lightning strike; when this happens the load has to be shed so that the remaining generators can maintain the required frequency. The standard to which the electricity supply companies work (EN 50160, implemented through regulation in the UK) allows a voltage range of 207-253V and frequency of 49.5-50.5Hz with allowance for short-term exceptions. The loss of generating capacity as part of the initial 9th August event was about 2,000MW, greater than the back-up response of 1GW that was held. This loss caused the system frequency to drop below the statutory limit of 49.5Hz, to 48.8Hz.Once the frequency of the system dropped to 48.8Hz, stage one (of nine) of the automatic protection system known as Low Frequency Demand Disconnection (LFDD) was triggered, which had the effect of disconnecting approximately 900MW of demand to arrest the fall in frequency.
The E3C committee's report explains the background better than I can:
Frequency plays an important role in the operation of the electricity system. Under normal operating conditions the Electricity System Operator (ESO) is obligated to maintain the system frequency between 49.8 and 50.2 Hz. If the network generation is higher than the demand the frequency rises, however conversely if generation is lower than the demand the frequency reduces. As the generation at any instant is unlikely to equal the demand the frequency constantly varies. The variation in frequency is normally small and has little impact on customers. Any variation in frequency must be controlled to enable certain items of equipment (e.g. clocks) to operate correctly. The ESO continuously monitors the frequency and dispatches the appropriate generator output. Should the total dispatch of generation available be insufficient to meet the demands due to a fault or loss of generation or an unexpected increase in demand, the frequency will fall.
Under exceptional circumstances (e.g. loss of a large generator) the frequency should not deviate outside the range 49.5 to 50.5Hz for more than 60 seconds. In order to achieve this, the ESO therefore brings on extra generation or reduces it to get the balance right. It buys ‘frequency response’ (back-up generation) services from generators, energy storage facilities and demand response providers who monitor the frequency of the electricity system and automatically adjust their power output or consumption to fine tune the balance.
In the event that the frequency deviates from the statutory limits for a sustained period of time, the LFDD is the last line of defence with each of the nine stages of this protection system being preprogramed to disconnect - through a series of relays - a defined amount of demand to balance electricity supply and demand. On 9 August, stage one of the LFDD scheme was successfully triggered when the system frequency dropped to 48.8Hz.
GB power system disruption on 9 August 2019, Energy Emergencies Executive Committee (E3C): Final report
Although some services were lost simply because their power was disconnected, others were disrupted because their own automatic protection systems responded to the falling frequency even though power was maintained:
The rail sector reported disruptions because Thameslink class 700 and 717 trains systems were overprotective to frequency drops on the electricity network and shut down. A number of trains required manual engineer intervention to restart trains and the complexity of the restart process caused significant disruptions. (See the ORR report for detail on this - it is a wonderful example of the unintended consequences of EMC and safety engineering.)
Other examples including hospitals, waterworks and an oil refinery are also listed.
Note that the Gridwatch website provides a near-real time overview of the UK National Grid generators and is well worth visiting for occasional interest. If you're interested in the detail of how the complex financial and systemic inter-relationships of the generators, grid operator and distribution companies work, the Elexon organisation has a useful Beginner's Guide to the Electricity Trading Arrangements.
What do the measurements say?
The measurement system is not traceably calibrated, so the accuracy of the data is by no means guaranteed; improvements have meant that about 0.02Hz for the frequency is roughly right. Of course, the measured voltage will depend on local loads so is only mildly interesting, but the frequency is unaffected by this. What was of greater interest to me was not the absolute values but the way they varied over time. You can see from pretty much all of the plots that the frequency generally stays within the bounds of ±0.1Hz as the ESO is constantly adjusting the supply generation to balance the demand, with occasional excursions towards ±0.2Hz. Very few of the measurement points have exceeded ±0.2Hz and then only for a very short time. This is in line with the above description of "normal operating conditions". There are occasional sharp drops in frequency which seem to correlate either with unusual load changes or weather conditions. Update, mid-Jan 2021: the "occasional excursions towards ±0.2Hz" seem to be getting rather more frequent in 2021 - there have been a few occasions when the frequency has gone beyond these limits, and the frequency is in general swinging more wildly around 50Hz than it used to.
Update 2, August 23: excursions to and beyond ±0.2Hz are definitely more frequent nowadays. The software has been modified to record 48 points around any excursion greater than or equal to 50.2Hz or less than or equal to 49.8Hz: the results now (Jan 24) have their own page. For the last four weeks, we've seen an average of nearly two such excursions a day; a couple of times there have been four in one day, and the df/dt is often more dramatic too. Both upwards and downwards excursions seem to occur with upwards swings in a slight majority. Perhaps this is down to an ever greater proportion of small, typically solar farm, generators on the network, which might tend to exacerbate instability; or is it related to the unfortunate practice of some generators taking advantage of the balancing mechanism in order to inflate their profits?
Update 3, October 23: further observation suggests that though there are many days when the excursions are well below the limits, on some days there are multiple and sometimes long-lasting excursions. See for instance Thursday 21st September, when between 2am and 3am and again from 10.50am to 11am the grid spent several minutes in excess of 50.2Hz; or Tuesday 3rd October, where seven excursions were recorded, one spending several minutes below 49.8Hz and dropping to 49.7Hz; or a similar story on Saturday 14th October.
The voltage variations are more marked, but this is not surprising since they are affected not only by the variations at the point of connection but also by loads on the wiring in the premises - the measurement is at a normal 13A socket outlet on one of the rings, not to the service entrance. The long-term average is something like 240-245V, and the actual voltage is very rarely close to the nominal of 230V. Presumably this is because each location has been fairly close to a distribution transformer (I haven't confirmed this); the supply standard allows 230V +10% and so the voltage is still within limits. (Remember that the UK nominal was 240V originally, when it was harmonised with the rest of Europe to 230V in two stages in 1995 and 2003). Earlier in the measurements at location 1 we had a higher average voltage, typically 245V, but a series of power outages in the local network resulted in remedial action on the part of the supplier which pushed it back to 240V.
However, all the graphs clearly show the regular diurnal pattern of voltage, well known to the supply authorities, with the pronounced dip around 5-6pm as people come home and put the kettle on.
The measurement project
This event triggered a desire on my part to see what the mains network frequency actually did on a day-to-day basis. Not expecting to see another such event (although, given the existence of the LFDD, it could happen at any time) but to see by how much the frequency does actually vary from minute to minute. Because a particular application of the 50Hz is to determine the timing of mains-powered digital clocks, the long-term frequency needs to be controlled to 50 Hz exactly, but short-term variations about this central value are acceptable and indeed normal.
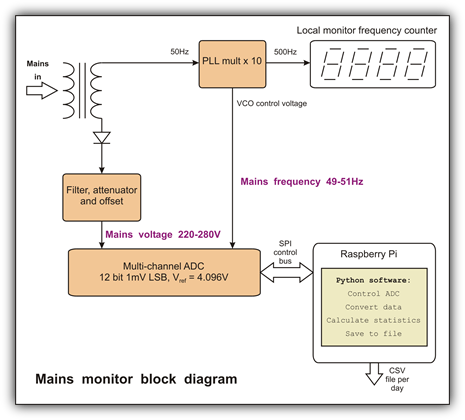
So I designed and built a very simple measurement and recording system - see the diagram opposite. (This gave me an opportunity and incentive to mess around with a Raspberry Pi, but that's a different story.)
Subsequently, the software has been extended to separately record times when the frequency has exceeded the limits of 49.8 or 50.2Hz. The results of this recording can be seen on the next page.
